In the app development process, our methodology focuses simultaneously on creating an engaging graphical interface and the essential technological aspect of the system. Alongside these two components, we pay special attention to building a robust database capable of efficiently and accurately managing data from sensors.

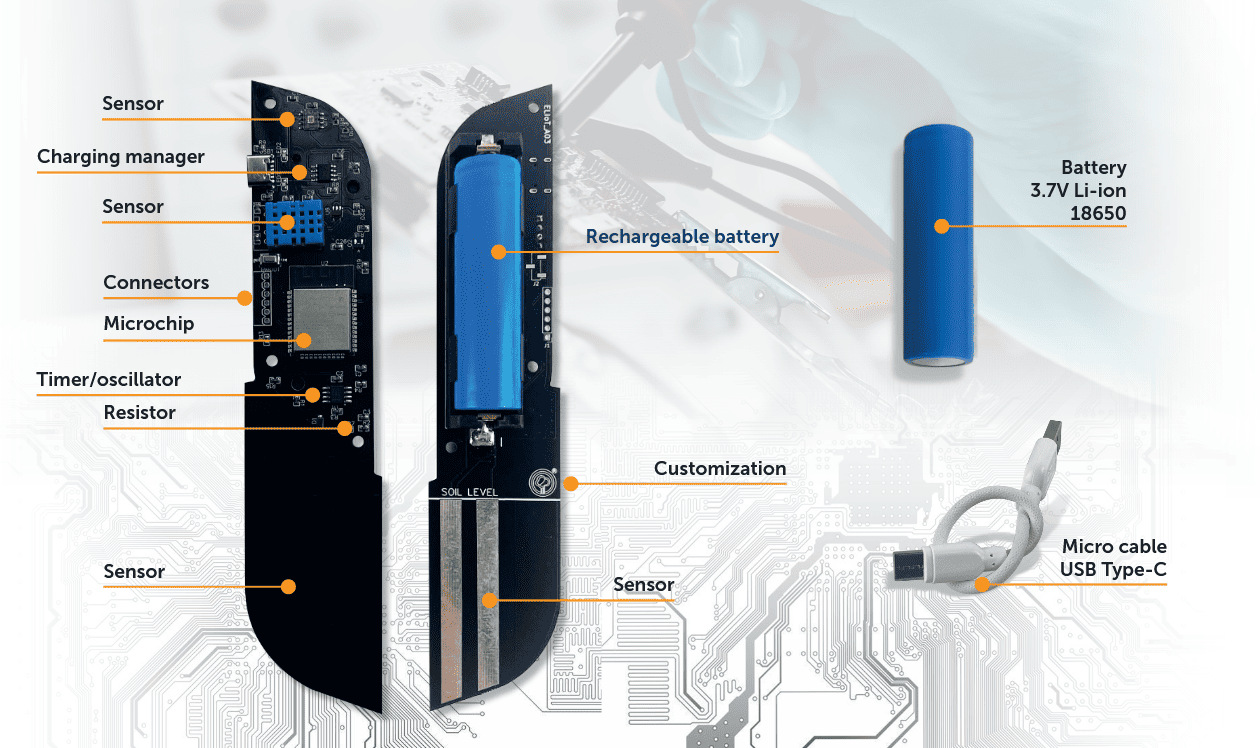
The design phase focuses on hypothesizing how we want the IoT sensor to be built. In addition to aesthetic aspects, we define how the sensors will access the desired information. This phase influences the PCB design and determines the choice of components. We also consider how the sensors will interact with the environment, such as in the case of specific fluids and flows to be monitored.
.png)
Prototyping applies the design to the PCB and the selected components. We test the functionalities, addressing potential issues and iterating through different versions of the prototype. Our background in Chemistry and Industrial Chemistry allows us to approach data analysis scientifically, correlating the collected information with known and reproducible data. During this phase, we also initiate the process of re-arranging raw data for continuous interpretation.

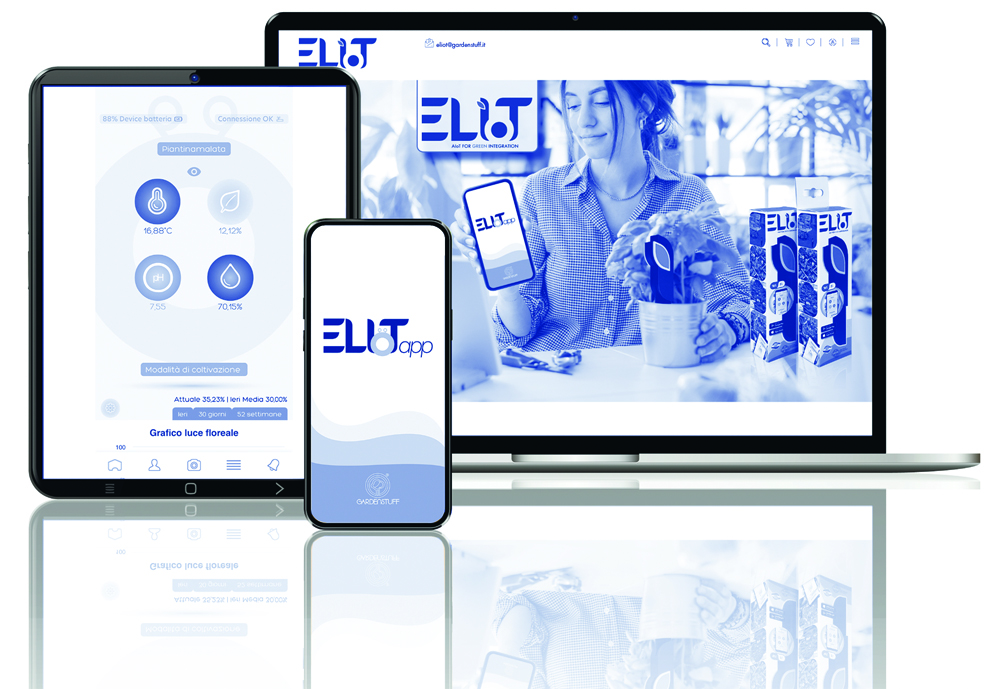
Graphic Development: The graphic design begins with a thorough analysis of the desired functionalities of the app. We define clearly and in detail how users will interact with the interface, determining the various screens and their transitions. During this phase, we aim to create an intuitive and aesthetically pleasing design, ensuring a smooth and engaging user experience
Technological Development: Simultaneously, we dive into the creation of the database that will serve as the repository for the data generated by the sensor. The database structure is carefully designed, including all the necessary tables to interpret and interpolate data consistently. Particular emphasis is placed on optimizing queries to ensure high performance and quick response times.
The sensor monitors the ideal light for plant blooming.
The sensor measures the ideal amount of light for the vegetative growth of plants.
The sensor measures the total amount of available visible light.
The sensor measures the total amount of light useful for plants.
Monitors the surrounding temperature.

Measures the humidity in the surrounding air.
Regulates the amount of humidity released into the environment.
Controls the soil pH to ensure proper nutrient uptake.
Monitors the nutrients in the soil, ensuring proper nutrition for the plants.

Constantly evaluates the soil moisture for proper irrigation.
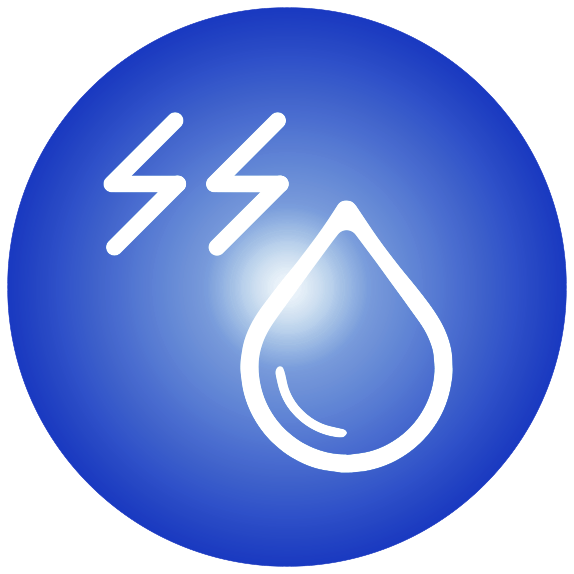
Identifies and manages plant stress caused by water scarcity.
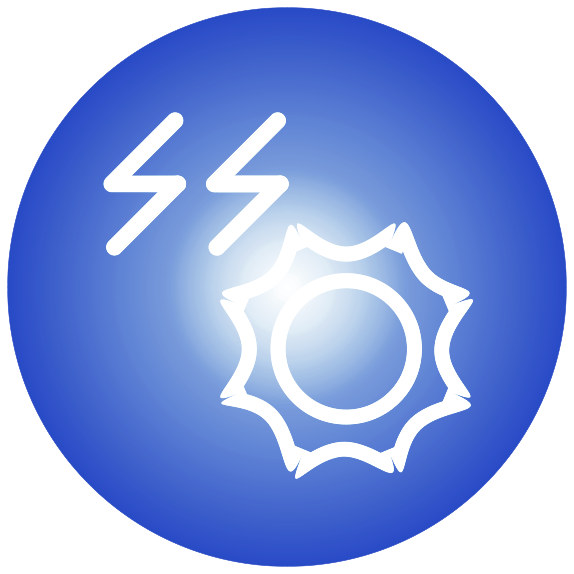
Detects situations of excess or lack of light to prevent plant stress.
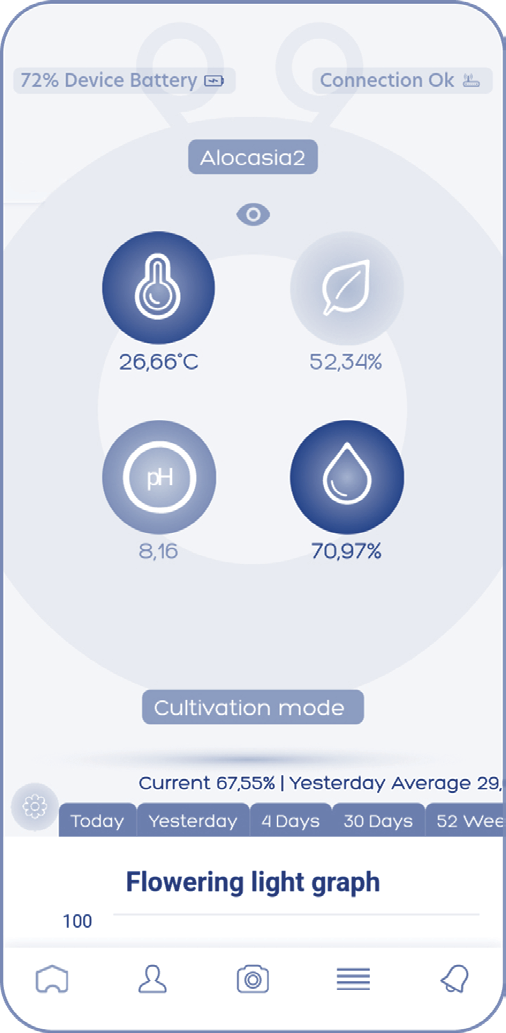
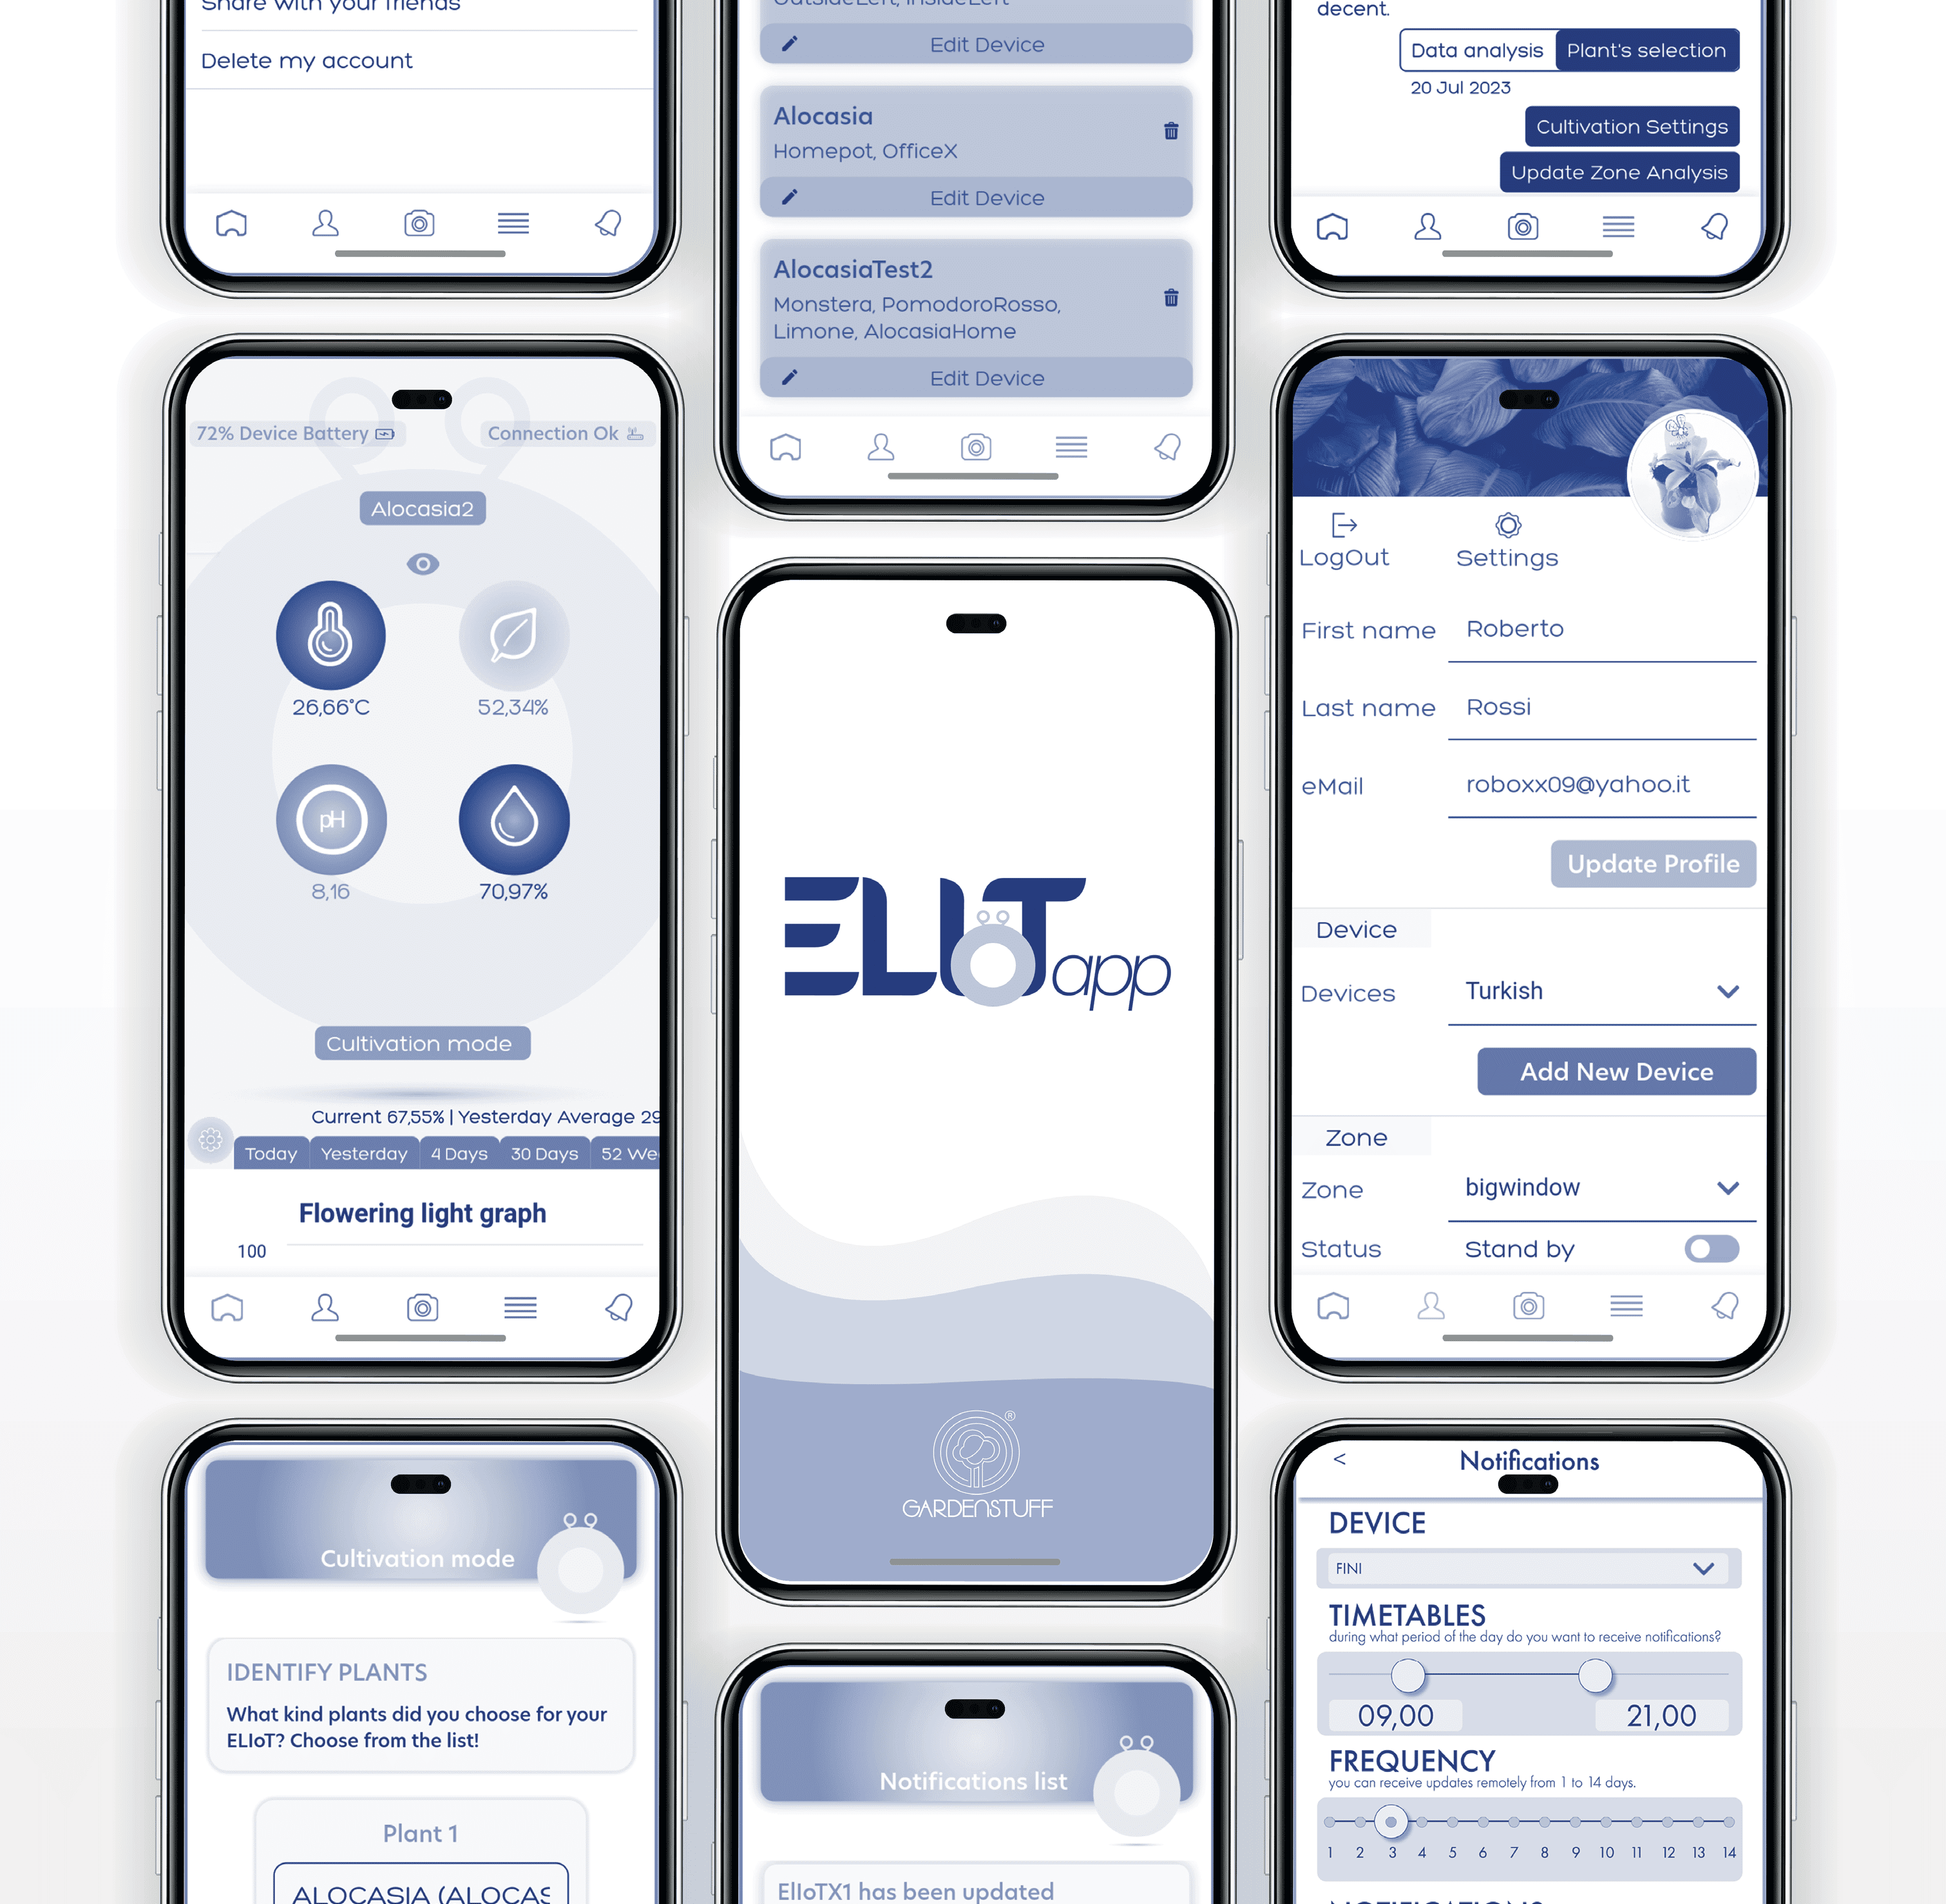
Main screen, everything within reach: from the latest updated data to detailed graphs.
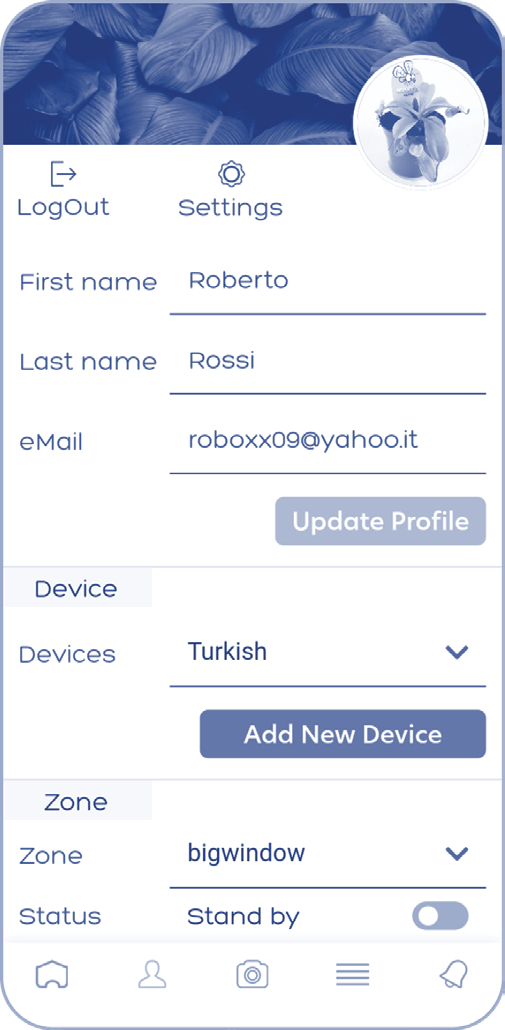
Add your data here and select ELIoT sensors, the areas to monitor, subscriptions, and access the maintenance and support page.
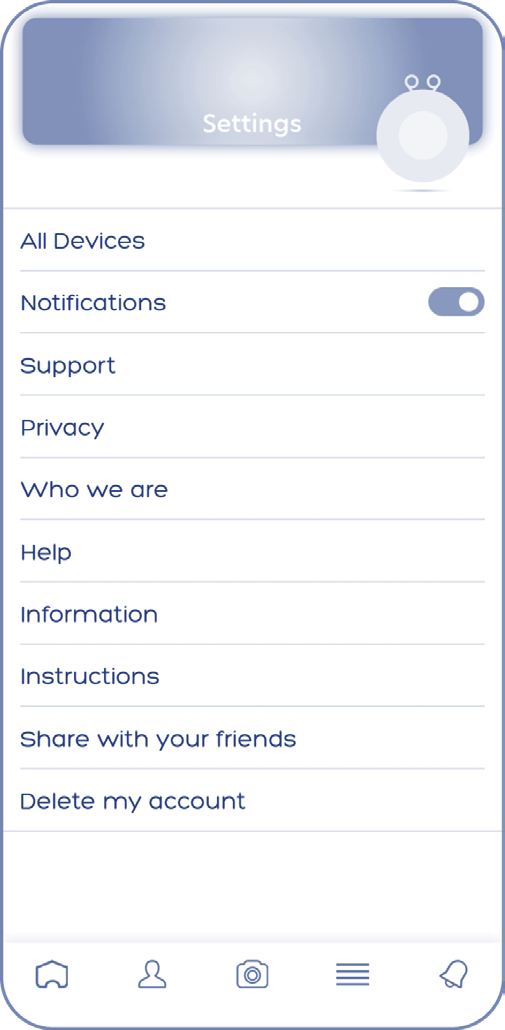
Manage your multisensors here, select preferences, and access the support, information, instructions, and sharing pages.
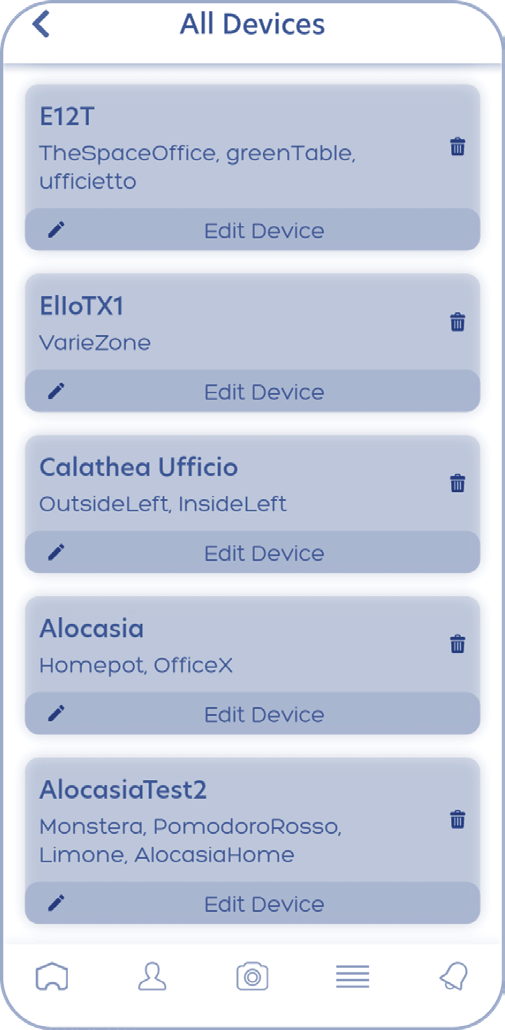
Edit, delete, and verify your connected devices from this page.
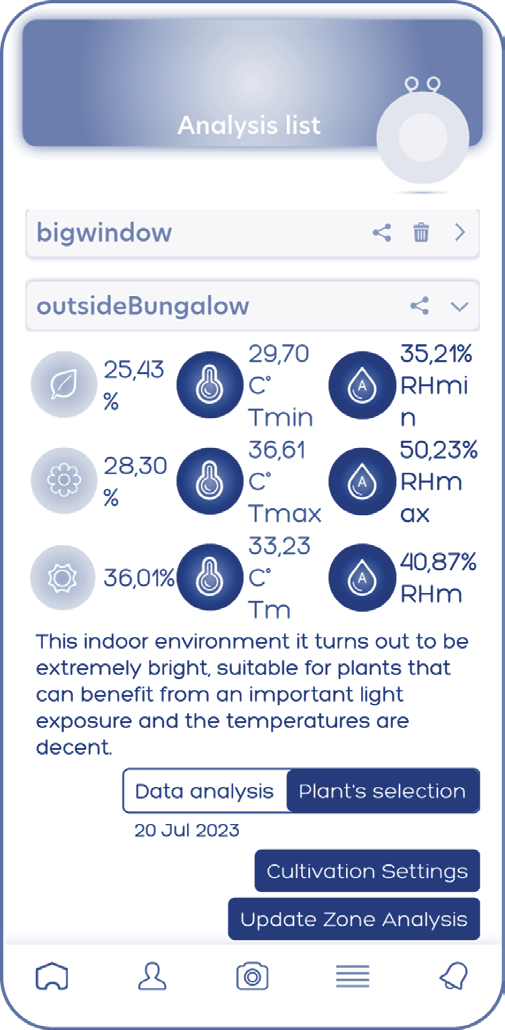
From this page, you can view all completed and ongoing analyses, modify parameters, update results, and select plants and specific accessories for each environment.
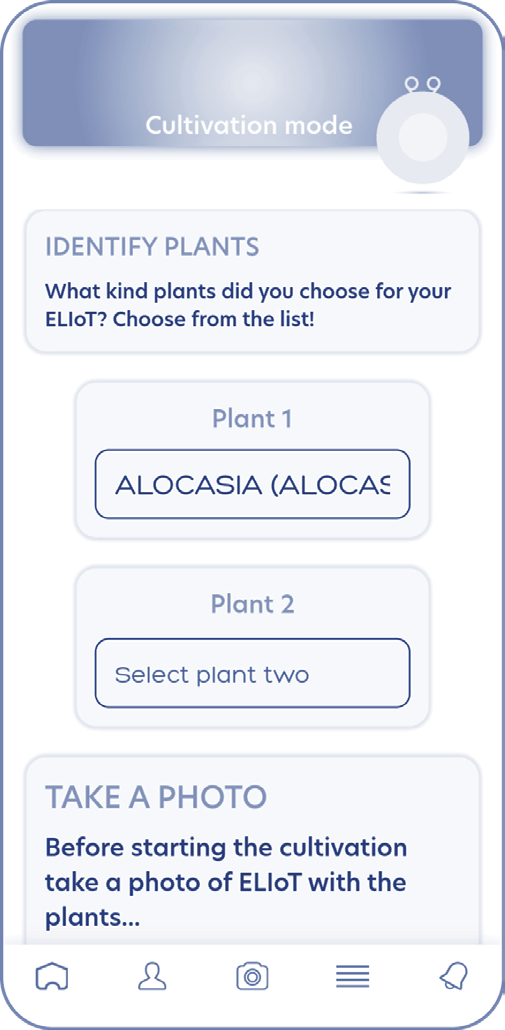
Select the plants near the ELIoT multisensor to tailor the reports and analyses to the specific plants present. Take a photo to uniquely identify the ELIoT location.
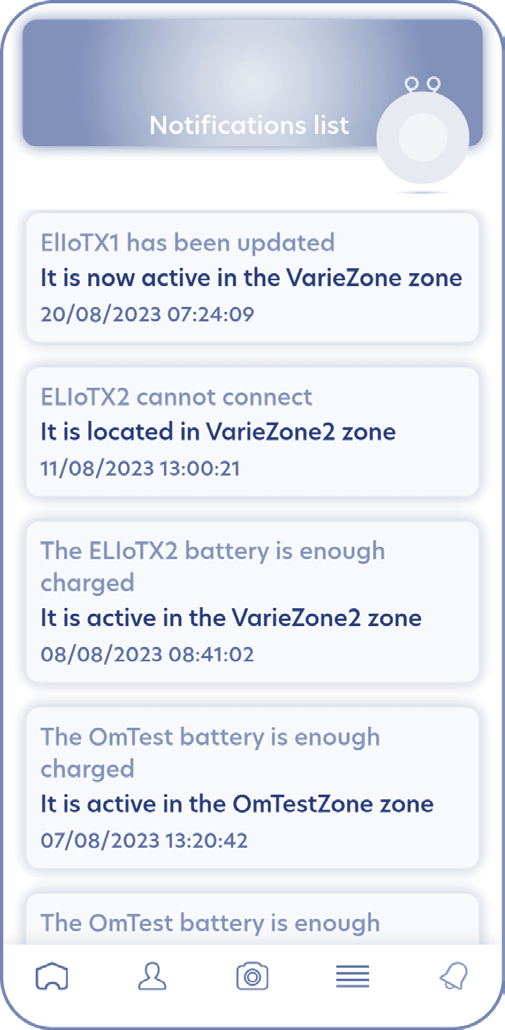
All notifications, tips, and insights dedicated to you are archived in chronological order.
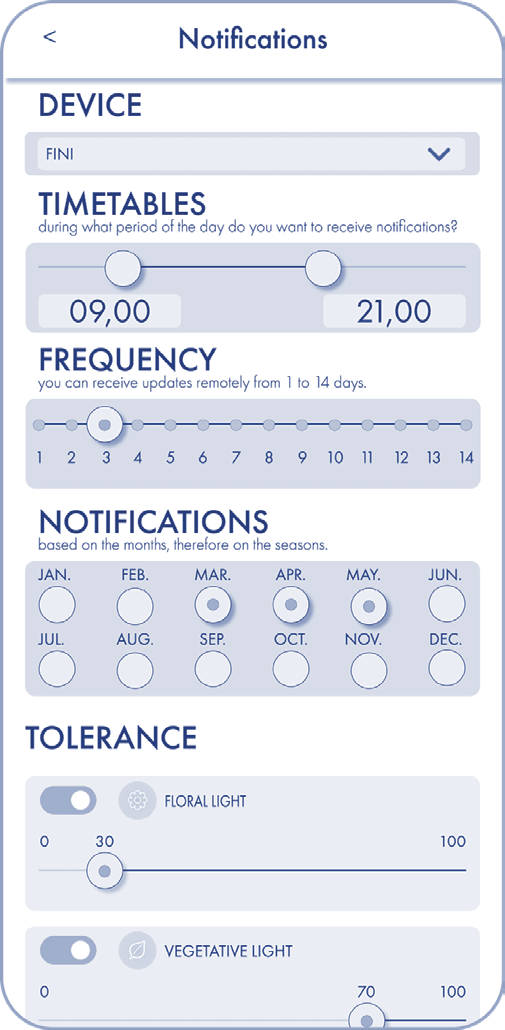
Receive timely alerts when a deviation from your preset limits occurs.

Vegetative Frequency (400-530 nm)
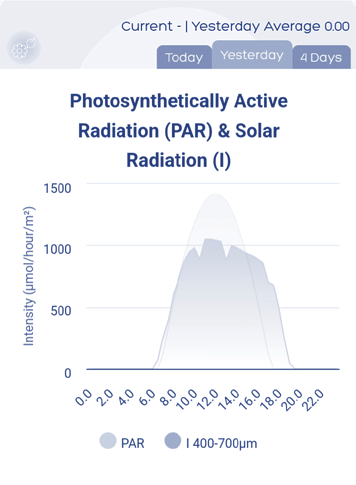
PAR (Photosynthetic Active Radiation)
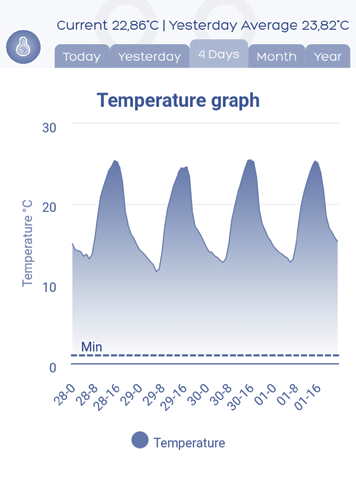
Temperature (°C)
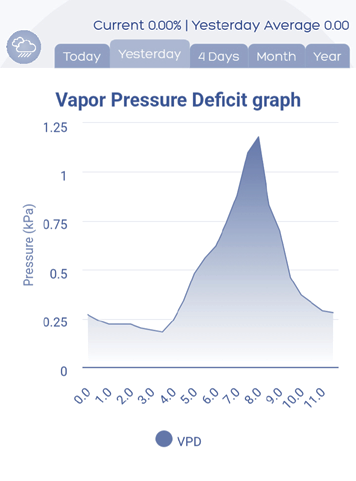
VPD, Vapor Pressure Deficit
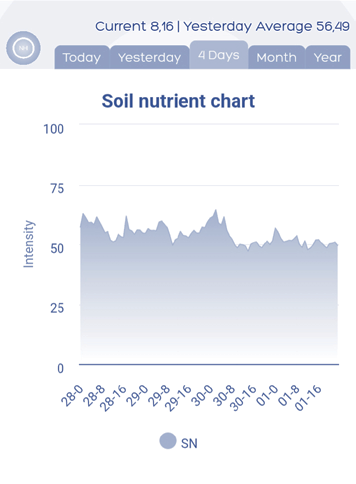
Soil Nutritional Values
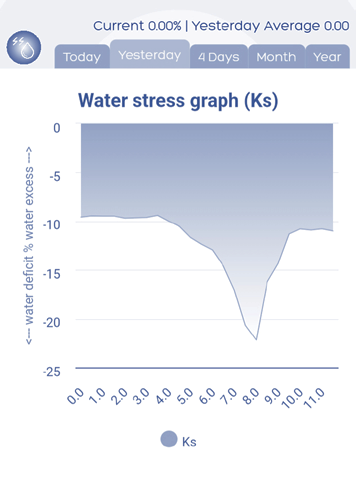
Plant Water Stress
Via Grazia Deledda, 11 - Legnano (MI) - ITALY
Write to us: contact@techcrafters.it
Telephone: +39 03311586334
P.IVA 09730010965
Request Assistance from Our Experts for Your Project:
If you need consultation or assistance from our experts, don’t hesitate to share the details of your project with us.
We are here to understand your needs and provide tailored solutions that ensure the success of your initiative.
Our team of qualified professionals is ready to tackle challenges of any kind and offer personalized consultancy to maximize efficiency and the final outcome of your project
To get started, we invite you to provide us with more information.
You can do so by replying to this email.
We will get back to you as soon as possible.
© Copyright 2026 Techcrafters - Soluzioni Tirinnanzi srl P.IVA 09730010965